
By Brian Alonso, Advisor
The third quarter of 2026 delivered the clearest sign of recovery the Alamance County industrial market has shown in two years. Trailing 12-month net absorption turned positive for the first time since Q3 2024, vacancy fell for a second straight quarter, and local pricing kept climbing, even as the Federal Reserve raised interest rates for the first time in more than three years. Rent growth continued to cool, more space came to market for lease, and the construction pipeline stayed lean, which leaves existing buildings with very little new competition.
Q3 2026: Local Market Performance
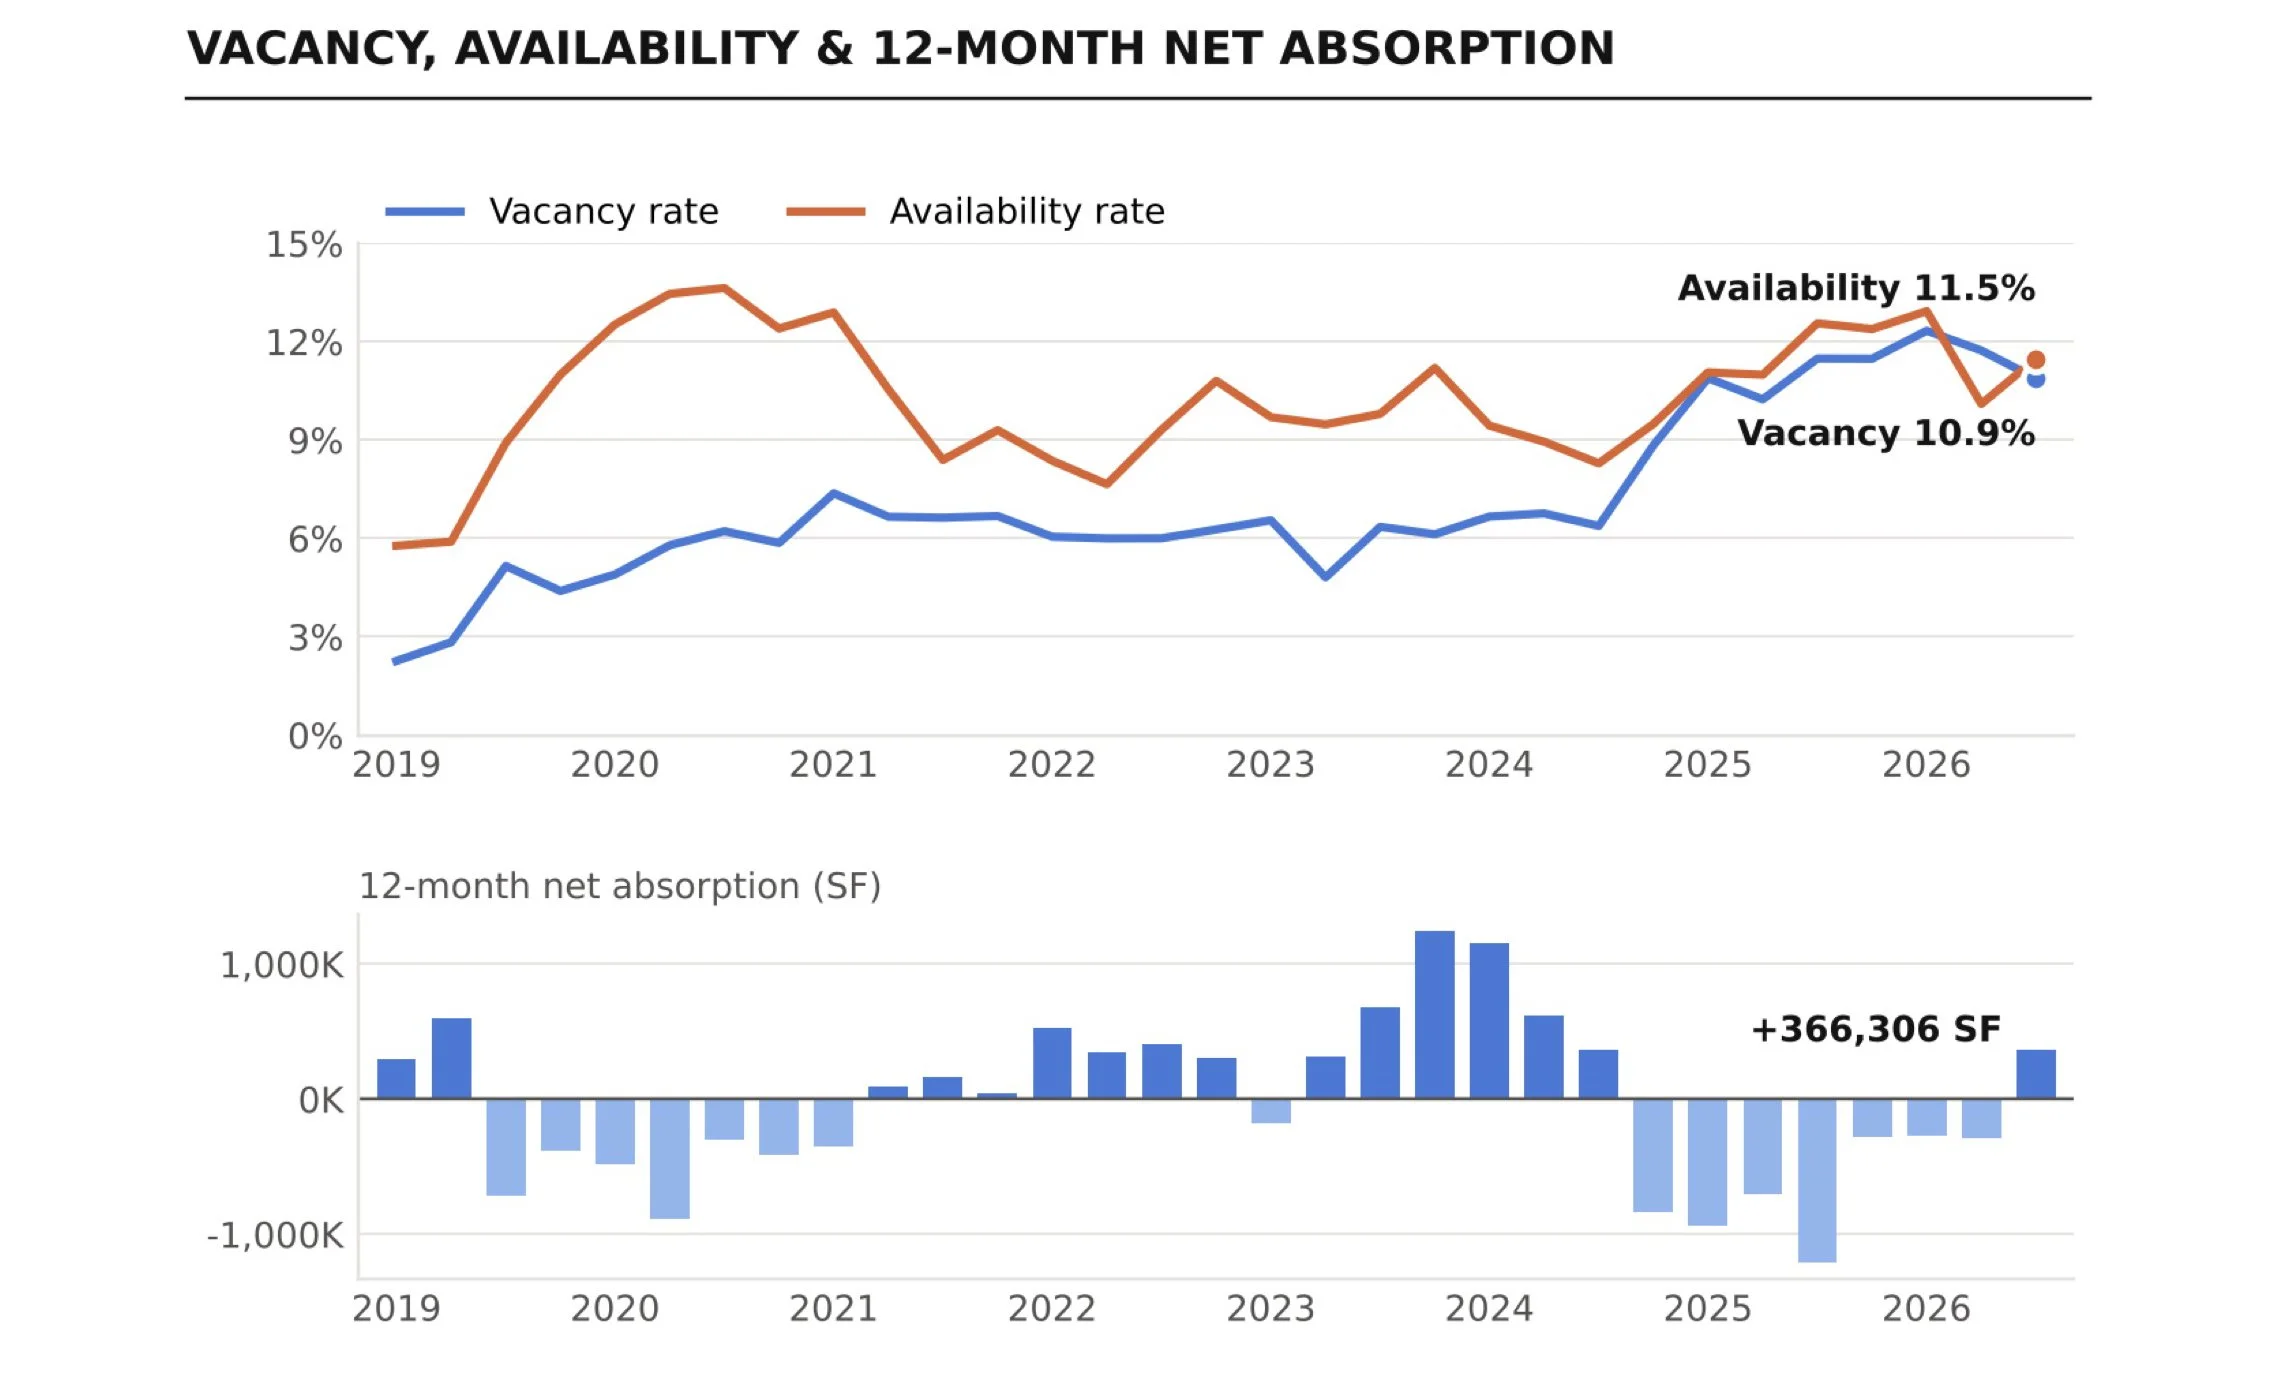
Local vacancy declined to 10.9%, down from 11.7% in Q2 and 12.3% at its Q1 peak. Tenants absorbed roughly 267,000 SF of space during the quarter alone, the second consecutive positive quarter, pushing trailing 12-month net absorption into positive territory at 366,306 SF. That is a sharp reversal from a year ago, when the market had recorded 1.2 million SF of net move-outs over the prior 12 months. Local asking rents edged up to $6.50/SF, while year-over-year rent growth slowed to 3.4% from 4.1% last quarter, still well ahead of the national pace.
Key Market Indicators for Q3 2026:
Vacancy Rate: 10.9%
Availability Rate: 11.5%
Market Total SF: 31.3M SF
Market Asking Rent: $6.50/SF
Asking Rent Growth: 3.4%
12 Mo Net Absorption: 366,306 SF
Under Construction: 127,500 SF
Source: CoStar Market Research
One indicator moved the other way. The availability rate, which captures all space actively marketed for lease (including space that is still occupied), rose to 11.5% from 10.1% in Q2 as roughly 435,000 SF of additional space came to market. In our last update we flagged falling availability as a possible early sign of tightening; this quarter's rebound tempers that signal. Much of the Q3 absorption reflected tenants moving into deals signed in the spring, while new lease signings over the summer were modest, so the next two quarters will show whether demand can keep pace with the space now being marketed.
Notable Transactions
The quarter's headline sale was 1736 Whites Kennel Rd in Burlington, a newly built (2025) 187,500-SF building that sold for $19.5 million ($104/SF) in late July. BlueScope Properties Group sold the building to Phillip Jeffries, and its full 187,500 SF was absorbed during the quarter, making it the single largest contributor to Q3 demand. At $104/SF for modern, large-format product, the sale sets a meaningful new benchmark for the county, well above the $81/SF paid in May for the then-vacant 369,420-SF building at 1017 Corporate Park Dr in Mebane.
Several other move-ins rounded out the quarter's absorption. PLI Fabrication occupied 143,000 SF at 2611 Lavista Dr in South Burlington following a lease signed in the spring, 2729 Ossipee Front St (80,000 SF) in northwest Alamance County was fully absorbed, and 174 Trollingwood Rd added another 27,940 SF of occupied space.
Over the trailing 12 months, CoStar recorded five priced sales in the 10,000–50,000 SF range that makes up the core of many local owners' portfolios, and together they tell a clear story about location and building quality. Two well-kept 1990s buildings in the airport area, 2056 Willow Springs Ln (34,416 SF, $103/SF) and 3119 Lear Dr (35,280 SF, $91/SF), traded at three to four times the price of three 1970s-era buildings in Graham that sold for $19–$30/SF. For owners in this size band, a building's age, condition and location now drive value far more than the countywide average suggests.
Market Value and Investment Trends
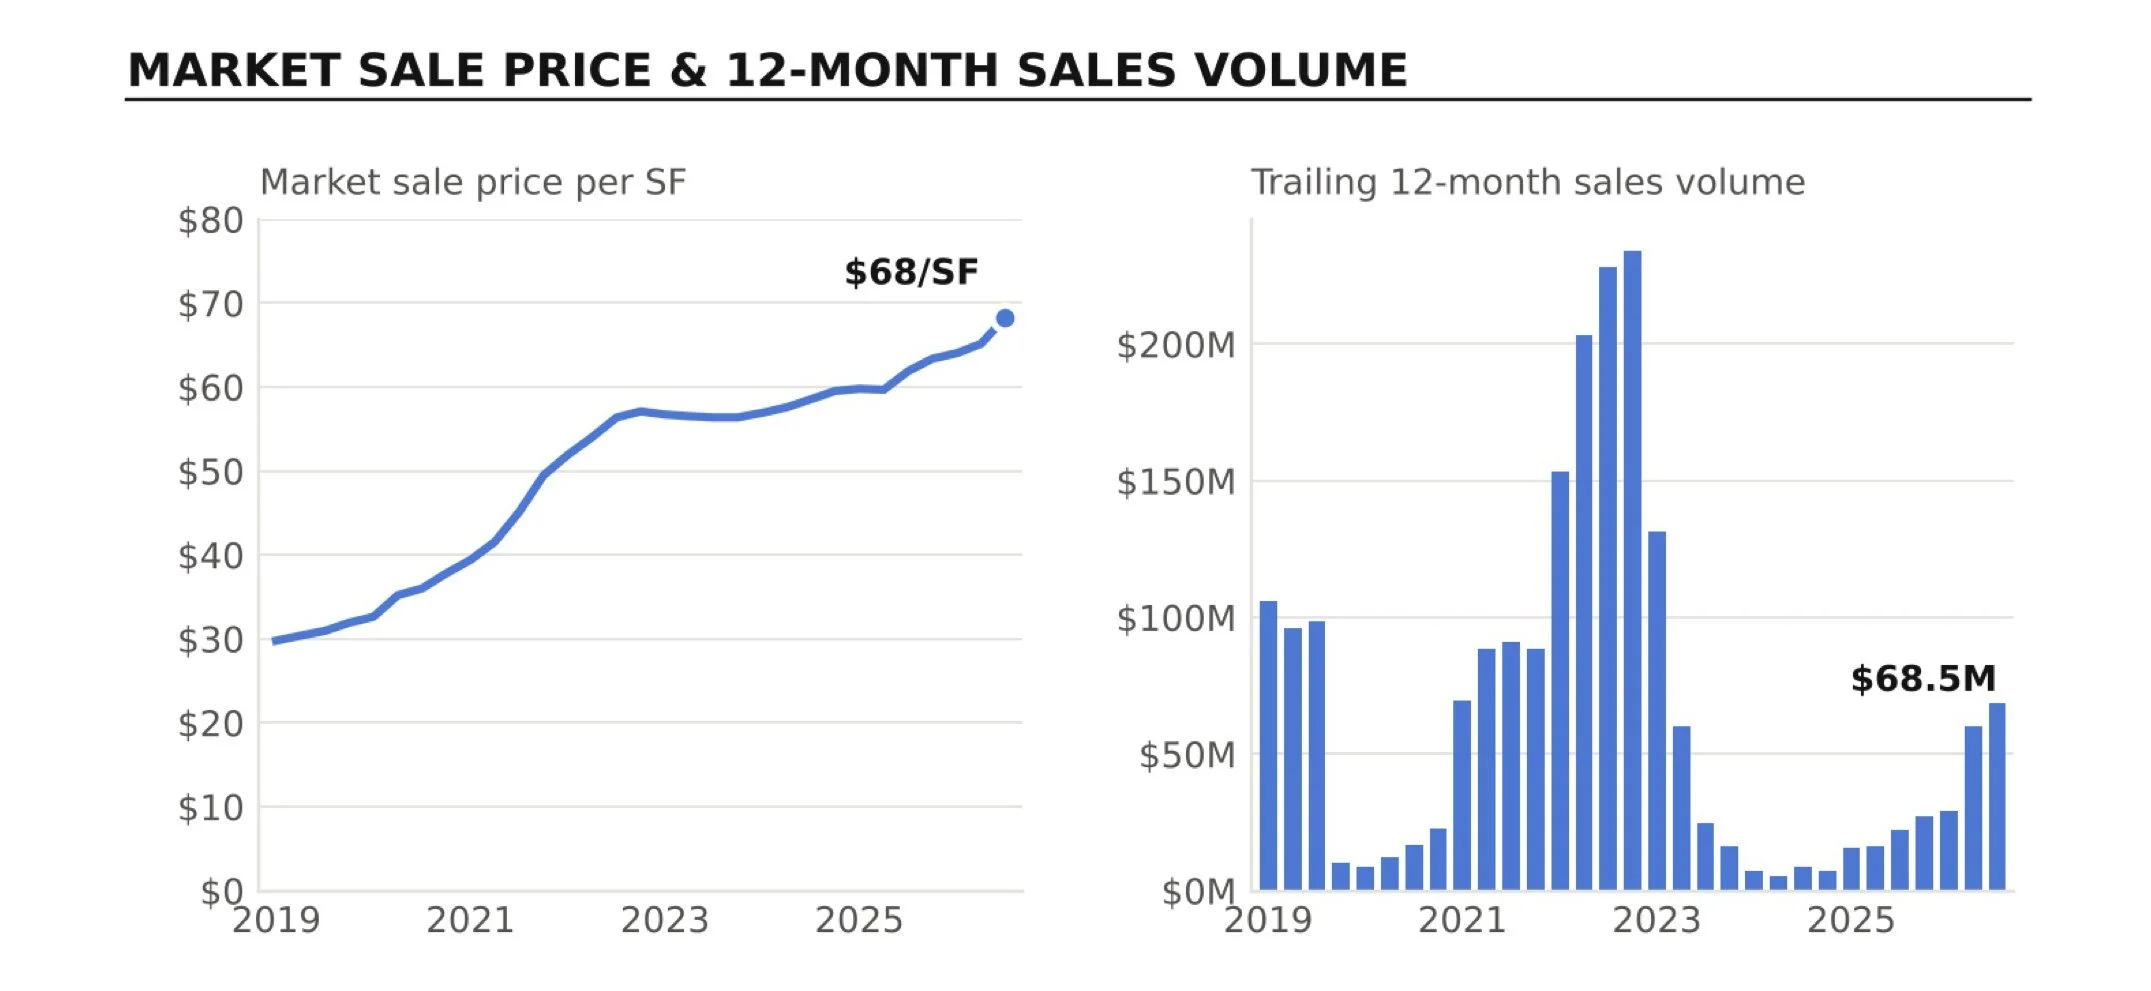
The total asset value of the Alamance County industrial market reached approximately $2.15 billion in the third quarter, up from $2.05 billion in Q2, a gain of nearly 5% in a single quarter. The market sale price per square foot rose to $68, up from $65 last quarter and roughly 10% higher than a year ago.
Pricing continues to vary considerably by asset class:
Logistics Properties: Averaging approximately $75/SF.
Flex Assets: Commanding a premium at $94/SF.
Specialized Buildings: Holding at a more accessible $61/SF.
Trailing 12-month transaction volume climbed to $68.5 million, up from $60.0 million last quarter and roughly triple the $22.4 million recorded a year ago, although the two large sales at Corporate Park Dr and Whites Kennel Rd account for nearly three-quarters of that total. The market cap rate compressed to 7.9% from 8.1% in Q2, its lowest level since 2023, but remains above the national average of roughly 7.3%, keeping local yields attractive relative to most markets. Rising values alongside a lower cap rate signal that investors are willing to pay more for Alamance County industrial income, which is a constructive backdrop for owners weighing a sale or refinance. As always, owners of smaller buildings should treat these countywide figures as a general backdrop rather than a direct comp.
Source: CoStar Market Research
National Context: The Broad View
U.S. nationwide industrial vacancy fell 5 basis points to 7.2% in Q3 2026, its second consecutive quarterly decline, and now sits slightly below its year-ago level, though still above the 15-year average of 6.2%. Vacancy across the South averaged 8.5%.
Demand outpaced new supply for a second straight quarter: net absorption reached 83 million square feet, the strongest quarterly total since 2022, against 71 million square feet of new deliveries. National warehouse/distribution asking rents edged up to $10.43/SF NNN, up just 0.7% year-over-year. One trend worth watching: the national construction pipeline grew for a third straight quarter to 329 million square feet, up 19% from a year ago and led by big-box projects in large Sun Belt metros.
Building size matters in the national data too. CoStar's national bulk distribution research shows buildings under 200,000 SF averaging 6.3% vacancy as of mid-2026, compared with 9.6% for larger big-box space, with most leasing activity concentrated in suites under 20,000 SF. That matches what we see locally: smaller, functional buildings remain the most liquid part of the market. Alamance County's 10.9% vacancy rate is still above the national average, but the gap narrowed to about 3.7 percentage points from roughly 4.4 points last quarter.
Economic Backdrop and Interest Rates
The biggest macroeconomic story of the quarter was the Federal Reserve's turn toward tightening. After holding rates at 3.50%–3.75% at its July meeting, with three dissents in favor of a hike, the Federal Open Market Committee voted unanimously on September 16 to raise the federal funds rate by 25 basis points to 3.75%–4.00%, its first increase since July 2023. Chair Kevin Warsh set the stage at Jackson Hole in late August, saying he would be “hard pressed to describe broad financial conditions as restrictive.” The Fed's updated projections show a median year-end 2026 rate of 4.1%, implying one more hike before year-end, and most participants do not expect inflation to return to the 2% target until 2029. The 10-year Treasury closed at 5.01% on the day of the decision.
Inflation remained sticky, driven largely by energy. Headline CPI held at 3.4% year-over-year in August as renewed conflict involving Iran pushed energy prices higher, even as core inflation cooled to 2.4%, its lowest reading since March 2021. The labor market sent mixed signals: employers added just 57,000 jobs in June and shed 23,000 in July before rebounding with 162,000 in August, and the unemployment rate stood at 4.1%. Second-quarter GDP grew at a modest 1.5% annualized rate.
For industrial real estate specifically, the signals remain constructive. The Logistics Managers' Index, a closely watched leading indicator for warehouse demand, reached 71.1 in June, its first reading above 70 since March 2022, and held at 68.9 in July, well above its long-run average. The new Section 301 tariffs that replaced the expiring global tariff in late July are expected to keep businesses carrying extra inventory, which supports warehouse demand. Industrial also remains the healthiest property type in commercial lending, with a CMBS distress rate of roughly 1%, far below office and multifamily. Closer to home, Alamance County's population is growing about 1.0% a year, five times the national rate, and local unemployment sits at 3.6%, below the U.S. average.
For Alamance County property owners, the takeaway is that higher-for-longer rates are now the base case, and financing costs are likely to stay elevated well into 2027. At the same time, construction costs are projected to rise another 4%–6% this year, with 50% tariffs on steel and aluminum adding to the cost of new buildings. Rising replacement costs and a thin development pipeline tend to favor owners of existing, well-maintained buildings.
Looking Ahead
The local construction pipeline remains lean at 127,500 square feet, just 0.4% of total inventory, and both projects under way are fully pre-leased, including an 85,000-SF Walmart facility expected to deliver in December. In practice, that means virtually no speculative space will compete with existing buildings for tenants in the near term.
That said, the recovery is not yet a straight line. The rise in availability this quarter, together with early fourth-quarter data showing renewed move-outs in older specialized manufacturing buildings, suggests local vacancy could tick back up before year-end. CoStar's forecast now calls for vacancy to finish 2026 near 12%, with rent growth around 2%. Property owners should watch three things heading into 2027: whether the space that came to market this quarter finds tenants; how much further the Fed raises rates and how that flows through to lending terms; and whether the strong pricing seen in this year's larger sales extends to the mid-size buildings that make up most of the local market.
