
Alamance County Industrial Market Update | Q2 2026
By Brian Alonso, Advisor
The second quarter of 2026 brought a modest but welcome improvement to the Alamance County industrial market. Local vacancy eased slightly from its Q1 high, available space marketed for lease shrank, and trailing 12-month sales volume more than doubled — headlined by one large institutional transaction. Activity in the 10,000–50,000 SF range, which continued to fetch higher per-square-foot pricing relative to larger product. Rent growth cooled alongside a national deceleration, and the construction pipeline remained as lean as it has been in years.
Q2 2026: Local Market Performance
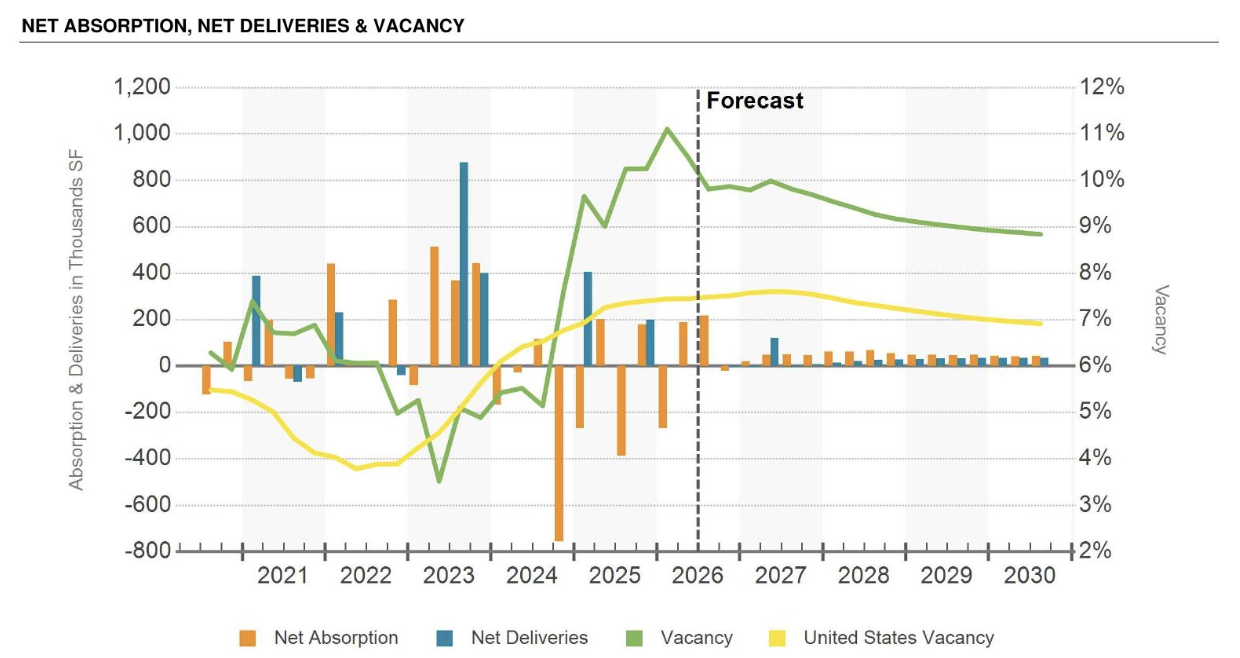
Local vacancy declined to 10.5%, down from 11.1% all-time high in Q1, while the broader availability rate — which captures all space actively marketed for lease — fell more sharply to 8.8%, down from 11.6% last quarter. Local asking rents ticked up to $6.42/SF, though year-over-year rent growth decelerated to 2.9%, in line with a broader national slowdown in rent appreciation.
Key Market Indicators for Q2 2026:
Vacancy Rate: 10.5%
Market Total SF: 31.4M SF
Market Asking Rent: $6.42/SF
Asking Rent Growth: 2.9%
12 Mo Net Absorption: (287,534) SF
Under Construction: 127,500 SF
Source: CoStar Market Research
Net absorption remained slightly negative for the quarter, but the sharp pullback in the availability rate is a notable signal — fewer blocks of space are being actively marketed even though occupied square footage has not yet turned the corner. That divergence is worth watching over the next quarter or two as a possible leading indicator of tightening conditions.
Notable Transactions
Two smaller buildings changed hands in Graham during the quarter: 205 W Harden St, a 5,280-SF building that sold for $1.1 million ($213/SF) in April, and 808 E Parker St, a 4,000-SF building that sold for $575,000 ($144/SF) the same month. Both sit below our usual 10,000-SF-and-up focus, but the pricing is instructive: small buildings continue to command a significant per-square-foot premium over larger product, a pattern that held throughout the quarter.
Zooming out to the trailing 12 months, ten sales closed in the 10,000–50,000 SF range that makes up the core of many local owners' portfolios, at prices ranging from $13/SF to $103/SF and averaging roughly $48/SF (median $35/SF). That's meaningfully below the countywide blended average, which continues to be pulled up by small premium-priced boxes and down by larger, partially vacant assets at the extremes — a reminder that countywide averages can be a noisy guide for a building in this size band.
The quarter's one large-scale deal is worth noting for context: 1017 Corporate Park Dr in Mebane, a 369,420-SF Class A distribution building, traded for $30.0 million ($81/SF) in May. Blue Owl Capital sold the asset — fully vacant at closing — to Principal Asset Management. On its own, this single transaction accounted for roughly half of the county's trailing 12-month industrial sales volume, and its lease-up will be worth watching as a bellwether for large-box demand, even though it sits well outside the size range most relevant to our core readership.
Market Value and Investment Trends
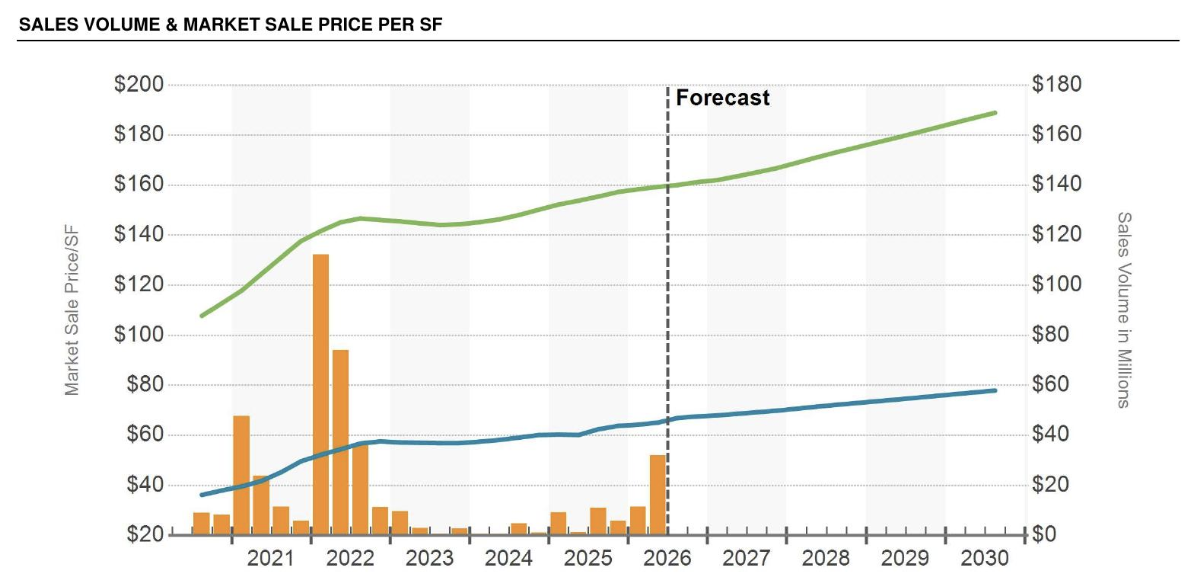
The total asset value of the Alamance County industrial market reached approximately $2.05 billion in the second quarter, up from $2.02 billion in Q1. The market sale price per square foot averaged $65, a modest increase from $64 last quarter.
Investors continue to see a bifurcated pricing environment based on asset class:
Logistics Properties: Averaging approximately $71/SF.
Flex Assets: Commanding a premium at $91/SF.
Specialized Buildings: Trading at a more accessible $61/SF.
Trailing 12-month transaction volume totaled $60.0 million, more than double the $29.3 million reported last quarter — though as noted above, that jump is driven substantially by the single Corporate Park Dr sale. The market cap rate held essentially flat at 8.2%, which continues to compare favorably to the national average of 7.4%, keeping the region attractive to capital seeking better relative yield. As always, owners of smaller buildings should treat these countywide blended figures as a general backdrop rather than a direct comp — pricing in the 10,000–50,000 SF range has consistently run at a meaningful premium per square foot to the large-box transactions that dominate headline volume.
Source: CoStar Market Research
National Context: The Broad View
Nationally, the industrial sector's vacancy rate appears to be stabilizing after more than two years of steady increases. According to Colliers, U.S. industrial vacancy averaged 7.3% in Q2 2026, down 7 basis points from the prior quarter and just 4 basis points above year-ago levels — still well above the 15-year historical average of 6.2%, but no longer climbing.
Demand outpaced new supply nationally for the quarter: net absorption totaled 59 million square feet, more than double the 27 million square feet absorbed a year ago, while new supply fell to 53 million square feet — the lowest quarterly total since 2016. Warehouse/distribution asking rents nationally were essentially flat at $10.34/SF NNN, down 1.6% year-over-year as the post-pandemic rent run-up continues to cool.
Alamance County's 10.5% vacancy rate remains above the national average, consistent with a market still digesting the supply added over the past several years. But with national absorption accelerating and local availability compressing, the gap appears to be narrowing rather than widening.
Economic Tailwinds and Regional Momentum
The macroeconomic backdrop turned more cautious during the quarter. At its June 17 meeting, the Federal Open Market Committee held rates steady at 3.50%-3.75% for a fourth consecutive meeting — the first meeting under new Chair Kevin Warsh, who adopted a notably more hawkish tone and stripped easing-bias language from the post-meeting statement. Updated projections show the median participant now expects the fed funds rate to end 2026 at 3.8%, up from 3.4% projected in March, with nine of eighteen participants penciling in at least one hike before year-end. The committee also revised its 2026 core PCE inflation forecast up sharply, to 3.3% from 2.7% in March.
Headline CPI inflation registered 4.2% year-over-year in May, the highest annual reading since April 2023, driven substantially by energy costs. Despite the inflation and rate uncertainty, employers added 172,000 jobs in May, well above consensus estimates, and unemployment held steady at 4.3%. The Logistics Managers' Index — a closely watched leading indicator for industrial real estate demand — registered 69.5 in May, its second-fastest pace of expansion since March 2022, pointing to continued strength in warehousing and transportation activity.
For Alamance County property owners, the combination of a higher-for-longer rate environment and resilient logistics activity cuts both ways: financing costs are likely to stay elevated for longer than previously expected, even as the underlying demand drivers for industrial space remain solid.
Looking Ahead
The local construction pipeline remains as lean as it has been in years, holding steady at 127,500 square feet, or just 0.4% of total inventory. CoStar's own forecast calls for local vacancy to end 2026 near 9.9% — essentially flat from where it stands today — with rent growth finishing the year around 1.9%.
The rebound in trailing sales volume, even though concentrated in one large transaction, signals that institutional capital continues to view Alamance County logistics product favorably, particularly at pricing well below national averages. Property owners should watch three things heading into the second half of the year: how quickly the vacant Corporate Park Dr building leases up as a bellwether for large-box demand locally; the trajectory of interest rates under new Fed leadership; and whether the recent strength in national logistics activity continues to translate into local absorption.
